

It doesn’t happen often, but every once in a while, I feel like an educational miracle worker or at least an educational genius. One year, the science and health/PE teachers came to me and said the ELLs were struggling with the cross-curricular unit they were teaching about nutrition. They asked me to do something to help them.
At about that same time, the math teacher came knocking on my door, talking about how the ELLs were not understanding percentages or even adding and subtracting decimals, for that matter. She, too, wanted me to do something to help them. The next teacher to come around, the ELA teacher, thankfully, wasn’t reporting that the students were struggling, but she did want to give me a heads up that a new unit was starting and the students would need to write a reflective essay at the end. If I had time, she thought it might be helpful for them to work on the essay with me. Four teachers doing three very different units, and all wanted me to do something to help them and our students. Oh, and then there were the language acquisition objectives that I still needed to meet because these were beginning-level language learners. I really didn’t know what to do, but I knew I had to do something. This nine-day mini-unit was the result.
Day One
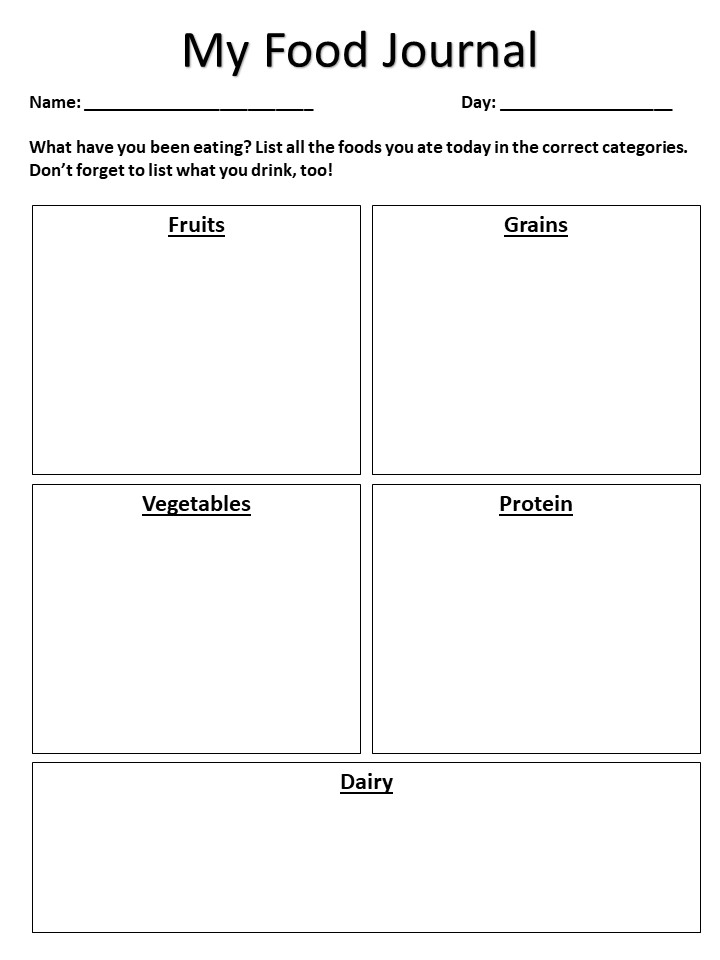

Every day, for the first five days of the unit, students kept a food journal, recording everything they ate and drank during the five days. This journal later becomes the pre-writing for a reflective essay about their food choices (helping out the ELA teacher). Also, on day one, we practiced food vocabulary (my language objectives). First, we used the cards from Appetizing Adjectives: The Board Game to classify foods by their food group (helping the science and PE teachers) with a pocket chart. I labeled each section of the chart with a food group, and students took turns drawing a card and placing it in the correct pocket. Prior to class, I made up a poster-sized food pyramid for each pair of students and gathered grocery ads. After the whole group practice, the students cut pictures from the ads and glued them into the correct sections of the pyramid, labeling them with their names. This activity is similar to the food quilts I’ve done as part of my appetizing adjectives lesson, but rather than focusing on adjectives, we focused on the vocabulary of food categories (dairy, grain, meat, etc.).
Day Two
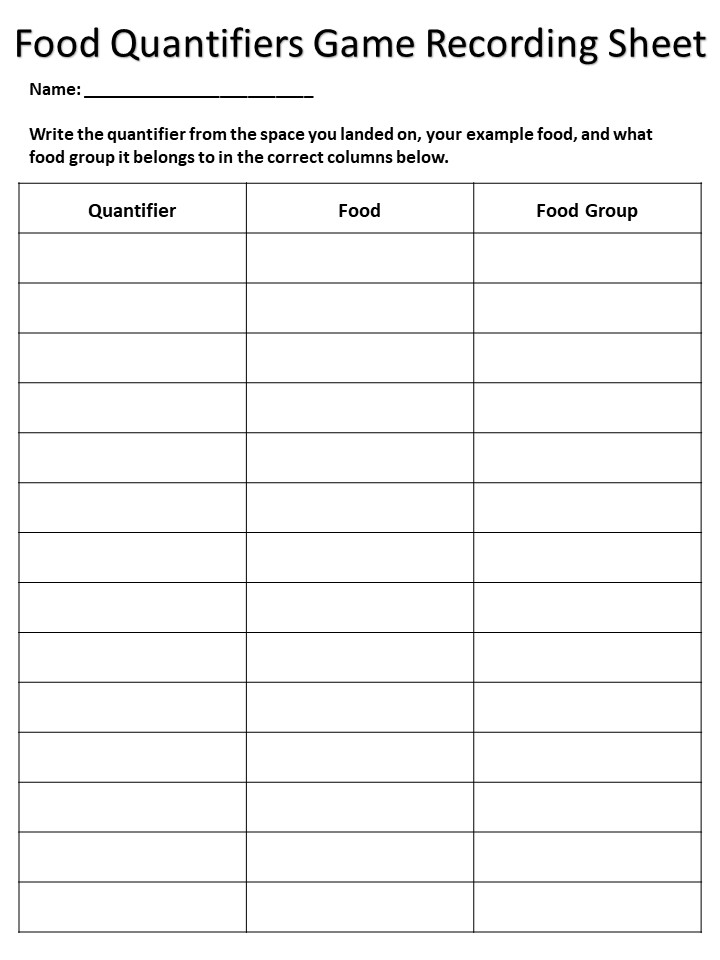
On day two, I reminded students to continue completing their food journals, and we expanded our vocabulary practice to include quantifiers (more language acquisition objectives). After reviewing the relevant vocabulary, we played two different games. The first, from ESL Galaxy, asks students to name a food that matches the quantifier of the space on which they land. For the second game, we again used Appetizing Adjectives: The Board Game. This time, when a student drew a card, he/she named the quantifier that would go with the food on the card (a head of broccoli, a bunch of bananas).
Day Three
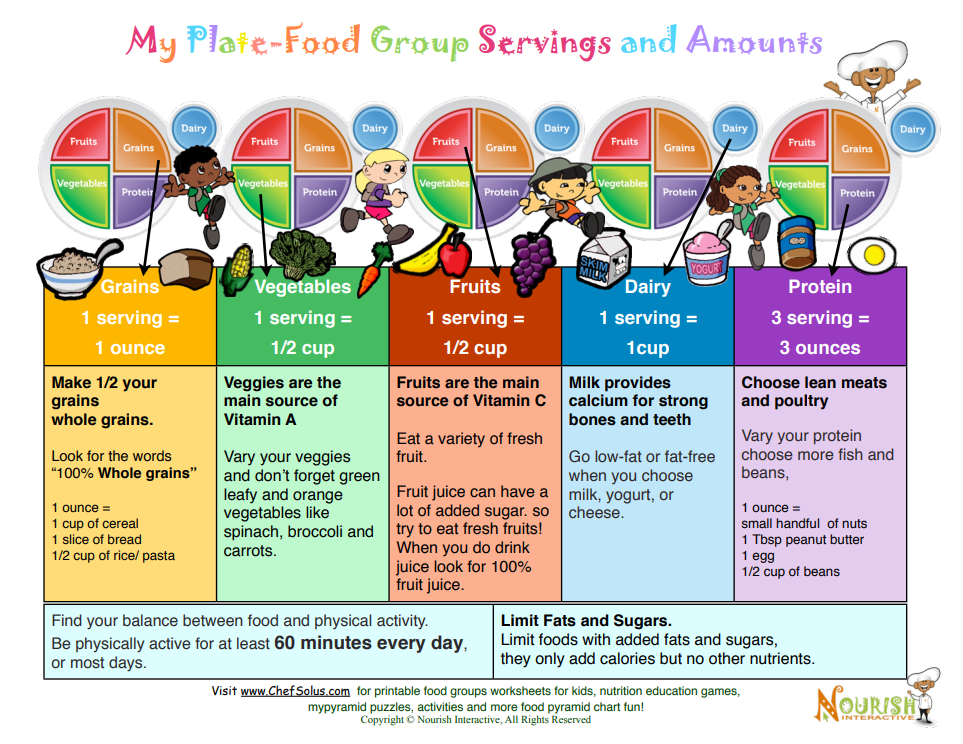
For this day, I used a couple of resources from Nourish Interactive. We used the food group healthy serving size sheet and the food group servings and amounts sheet to discuss portion/serving sizes and how they relate to the food pyramid/plate. After discussing this, we used paper plates and a
construction paper circle (the glass) glued on a larger piece of construction paper (the tray) to create our own MyPlate. The students cut pictures from a grocery ad to classify their favorite foods and/or make a healthy meal (helping out the science/PE teachers again).
Day Four
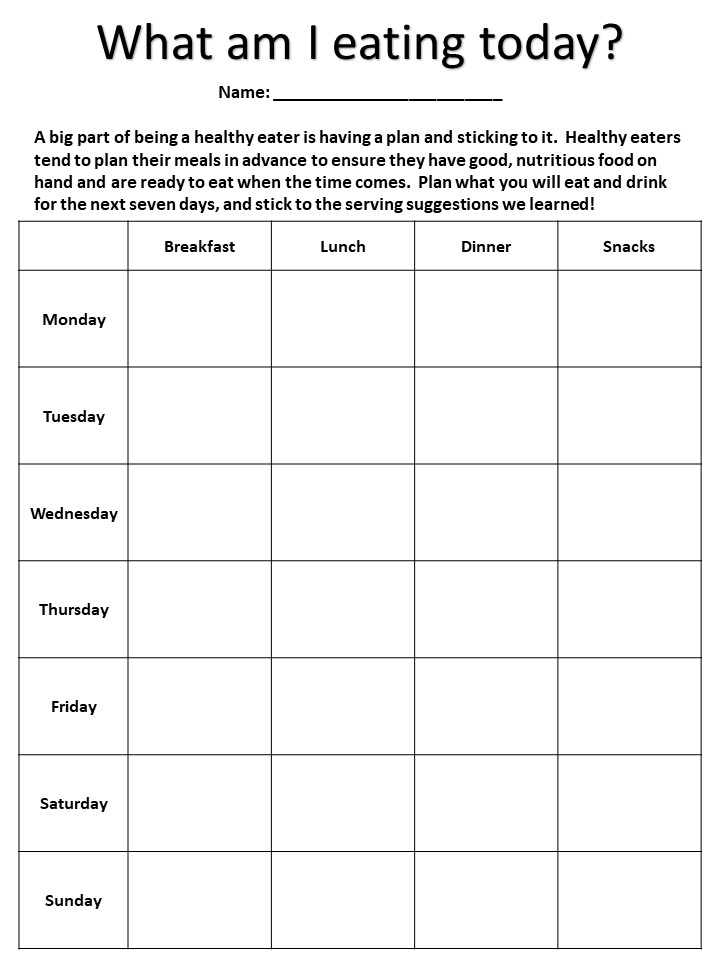
Now that students better understood what it means to eat in a healthy manner, it was time to start applying this knowledge. We used the government’s MyPlate Plan online activity to develop a personalized eating plan. They then used the graphic organizer to decide what they would eat each day for an entire week. I told them not to worry about specific ingredients but to pay attention to portion size and the serving guidelines we learned about the day before.
Day Five
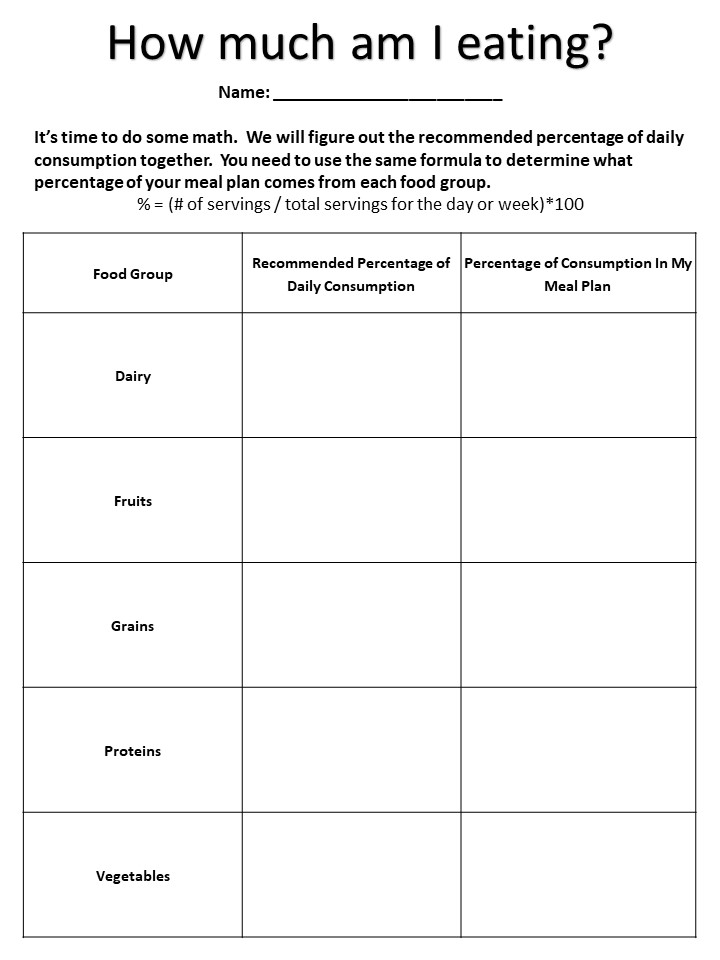
I hadn’t forgotten about the math teacher’s request, and on day five, we started to do some math. First, we reviewed the percentage formula (number of servings divided by the total servings for the day/week multiplied by one hundred). Then, students determined what percentage of their daily servings should come from each food group. They then transferred the meal plan they made in the previous lesson to a MyPlate graphic organizer, listing the food and the number of servings. Finally, they determined what percentage of their servings came from each food group and compared it with the government recommendations. The students required a fair amount of support at first, but by the end, they were getting quite good at using the formula.
Day Six
Now that our food journals were complete, we took day six to work on our reflection essays (helping the ELA teacher). Students used their food journals as reference material and wrote an essay answering the prompt: “Was your eating over the last five days healthy? Why or why not?” I encouraged them to use evidence from their learning about nutrition to support their answers. Besides the food journals, I also encouraged students to use a CER graphic organizer to help them organize their thoughts before writing.
Days Seven and Eight
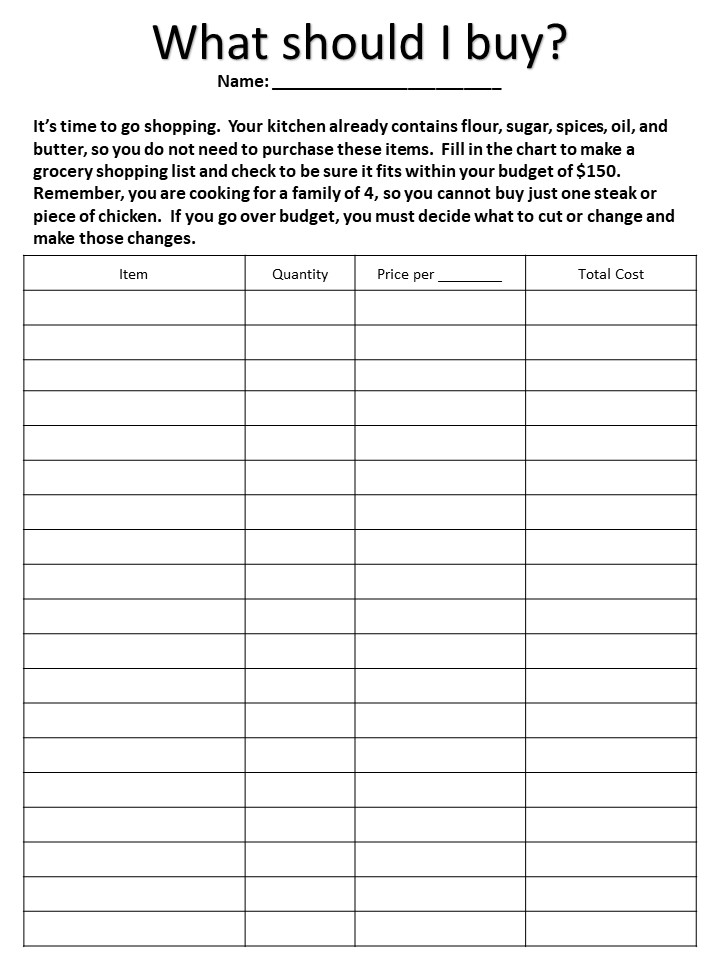
I had warned students ahead of time that we would be doing this project so they could ask their families for recipes and come prepared with an idea of what groceries they would need to put on their lists. Before beginning work, I told students that they would not need to buy certain basic supplies (flour, sugar, spices, oil, and butter) because they were “already in the kitchen.” Students then used their meal plan to create a grocery
list, including quantities for each item. The list was then used as a reference as they looked through ads and used grocery store websites/apps to record the price per item and the total cost for the amount they would need. It took us two days to make a grocery list, look up prices, do the math for the budget (I told them they could only spend $150), and make adjustments to the overall plan.
Day Nine
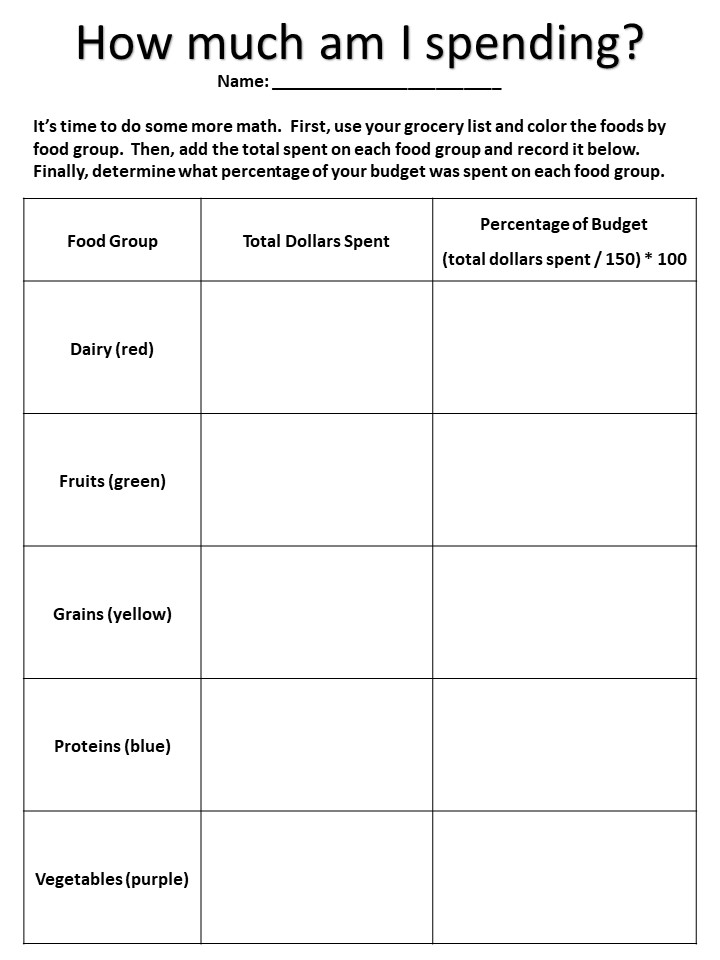
On the final day of our unit, I wanted to practice percentages again. I asked students to figure out what percentage of their budget they spent on each food group. They used their grocery shopping list to help them get organized and underlined each item with a different color of pencil based on the food groups. They then did the math to figure out the total spent on food from each group and recorded it in the graphic organizer. After this, they figured out the percentage of their budget spent on each food group. We even snuck in some graph-making practice by creating a circle graph to represent their budgets visually!
Conclusion
This unit turned out to be a lot of fun, and I’ve used it a couple of times since. Recently, I revisited it and refreshed all of the graphic organizers. If you don’t have the time (or desire) to make your own graphic organizers for the unit, you can grab mine by clicking any of the pictures. Happy teaching, everyone!
